In this article, we will explore the artistic component of mathematics. Specifically, we will look at the Mandelbrot set– a set of complex numbers that exhibits artistic beauty.
What Constitutes the Mandelbrot Set?
The Mandelbrot set is a mathematical set of complex numbers. When we plot the points inside and outside this set we can observe mesmerizing fractal patterns. The Mandelbrot set is defined by the behavior of the recursive equation $z = z^2 + c$, where $z$ and $c$ are complex numbers. A complex number $c$ is an element of the Mandelbrot set if the iterative sequence defined by the equation $z = z^2 + c$ remains bounded as the number of iterations increases. In other words, as the equation is repeatedly applied to $z$, the magnitude of z does not exceed a certain threshold value.
Generating the Mandelbrot Set
To determine whether a complex number $c$ is in the Mandelbrot set, the iteration starts with $z = 0$ and repeatedly computes the equation $z = z^2 + c$ until one of the two conditions is met:
- When the magnitude of z exceeds a certain threshold (usually 2)
- When the number of iterations (
num_iter) reaches a specified maximum number of iterations (max_iter)
If the magnitude of $z$ is greater than $2$ before we reach the maximum number of iterations, it is safe to say that $z$ will probably go to infinity. So, given a complex number $c$, we will iteratively compute $z = z^2 + c$. If $\lvert z \rvert > 2$ while num_iter < max_iter, then $c$ is not in the Mandelbrot set. Conversely, if we keep iteratively calculating $z = z^2 + c$ and observe that the magnitude of $z$ is less than $2$ even after we reach the maximum number of iterations, then $c$ is in the Mandelbrot set.
Below is the pseudo-code and a diagram illustrating the process of generating the Mandelbrot set.
let z = 0
let num_iter = 0
let max_iter = 100 //adjustable
while magnitude of z <= 2 AND num_iter < max_iter:
	z = z * z + c
	num_iter += 1
return num_iter
All the points with num_iter == max_iter are inside the Mandelbrot set. In theory, we will need to test every point $c$ in the complex plane. However, due to the infinite nature of the complex plane, we cannot test every point. In practice, we will refine our window to a finite region in the complex plane and compute the Mandelbrot set for a discrete set of points in that region. Typically, we bound a region with real and imaginary axes. In this article, the region is defined by the boundaries $-2$ to $1$ for the real (horizontal) axis, and $-1$ to $1$ for the imaginary (vertical) axis.
We will generate a $600 \times 400$ pixels plot. So, we will need to convert each pixel coordinate $(x,y)$ to its corresponding complex value $c$. I consulted this website for the conversion and the codes.

Visualizing the Mandelbrot Set in Tableau
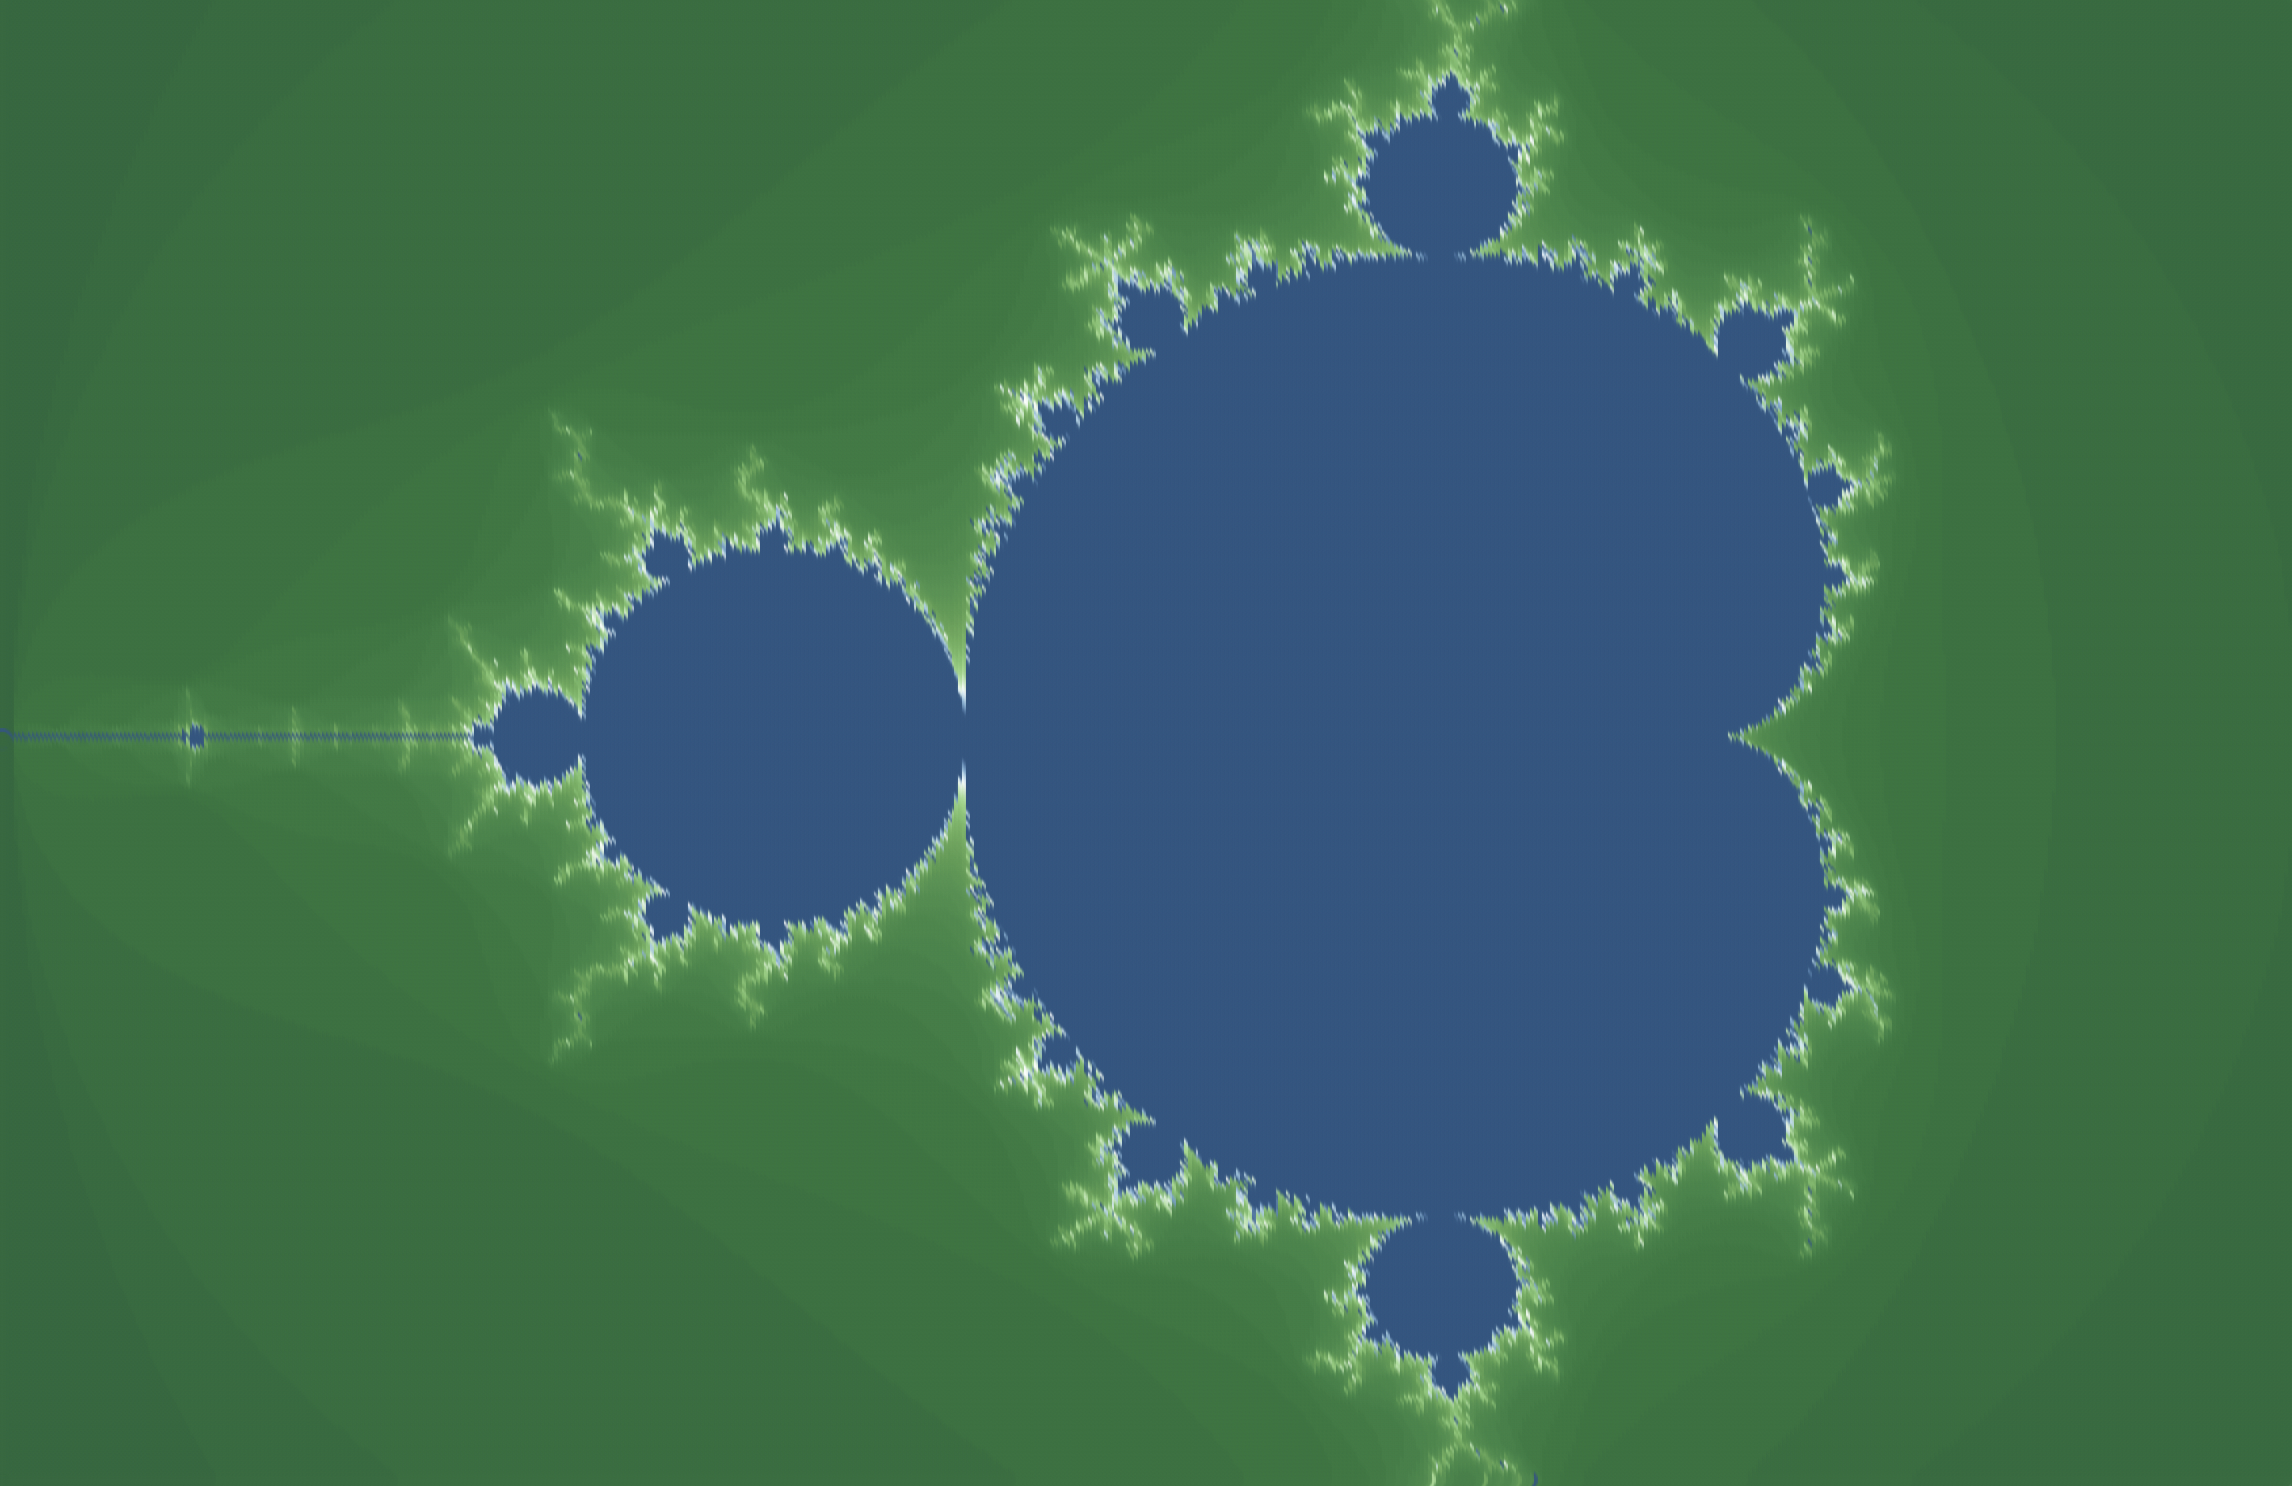
We will use Tableau to visualize the Mandelbrot set. One can also directly plot this set in Python. The workbook below can also be viewed on Tableau Public. As we can see, all the points in the Mandelbrot set (all the points with num_iter == max_iter) are represented by one color (blue). The other points with num_iter < max_iter are points not in the set. Depending on the actual value of num_iter, we use a different shade of green to color-code the number of iterations it took for the magnitude of $z$ to exceed $2$. The boundaries between the points inside and outside the Mandelbrot set exhibit intriguing fractal patterns. You can hover the cursor near the boundaries (the thin white regions around the blue shape) and see that this pattern is a result of having different num_iter values for each pixel point.
Below is a more zoomed-in view of this boundary region. Each pixel point has a different color depending on the number of iterations it took for $z$ to exceed the threshold of $2$, or the maximum iteration we specified. This is what gives the boundaries mesmerizing fractal patterns. Unfortunately, we do not have a clear image since each pixel is represented by a point and we only have a $600 \times 400$ pixel plot.

This video may help you visualize what happens if we indefinitely zoom into the boundaries.